

Inspect a trace
Open any row in Evidence → Logs (or a retained direct/traces/{id} link) to inspect one
production or staging interaction. The detail page leads with an
investigation spine (what happened → observed failure → related evidence), then the span/collection tabs.
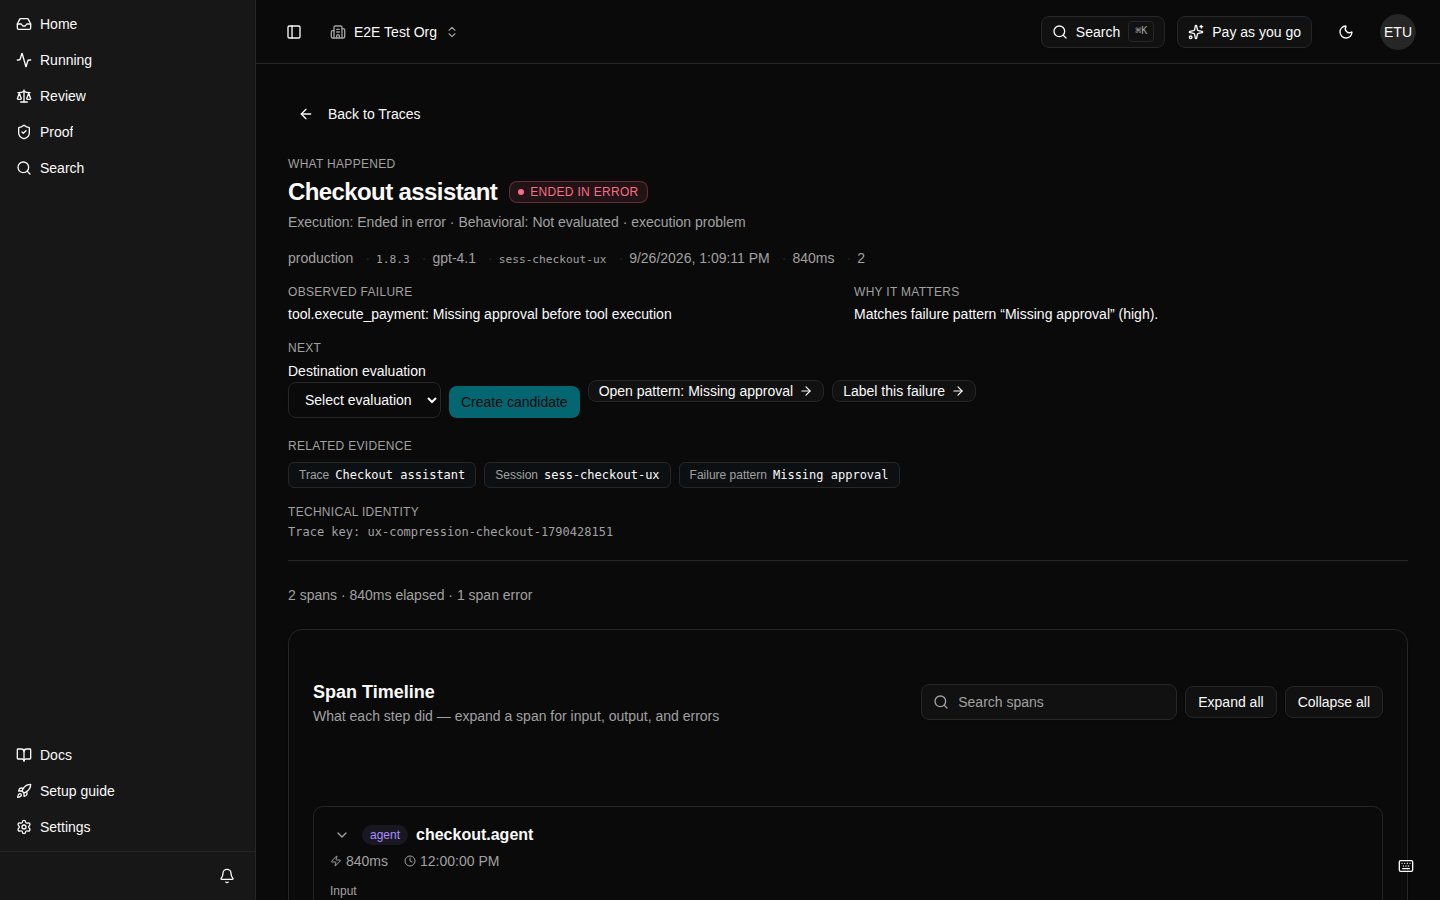
What you see first
Before tabs, the page answers:- Identity and outcome — environment, release/version when known, and an honest execution badge (failed / completed / error). Completed without a measured evaluation is not labeled as Succeeded.
- Observed failure — the concrete span or analysis signal that failed, when present. This is execution truth, not a behavioral pass/fail judgment.
- Related evidence — session, failure pattern, evaluation run, candidate, review, or release links when those correlations exist. Missing links stay absent; EvalGate does not invent them.
- Prepared next actions — for example Label this failure or Create candidate when the current evidence supports them.
The tabs
When a collection has more than 100 records, use its Load more control
until the continuation is complete. The counts are exact, not estimates.
What to look for next
- Observed failure / Tools — confirm the failing span and whether a tool error masquerades as a model failure.
- Timeline — find the long span. That is usually where time goes.
- Related evidence — open a linked Failure pattern or evaluation run when present.
- Cost — a cost spike with few user-facing turns often means a hidden loop.
- Evidence — if provenance is
incomplete, this trace cannot be used as release evidence until the gap is fixed.