

Finding your way around EvalGate
The EvalGate web app has two main areas: the sidebar on the left and the main panel on the right. Everything you do happens in one of them.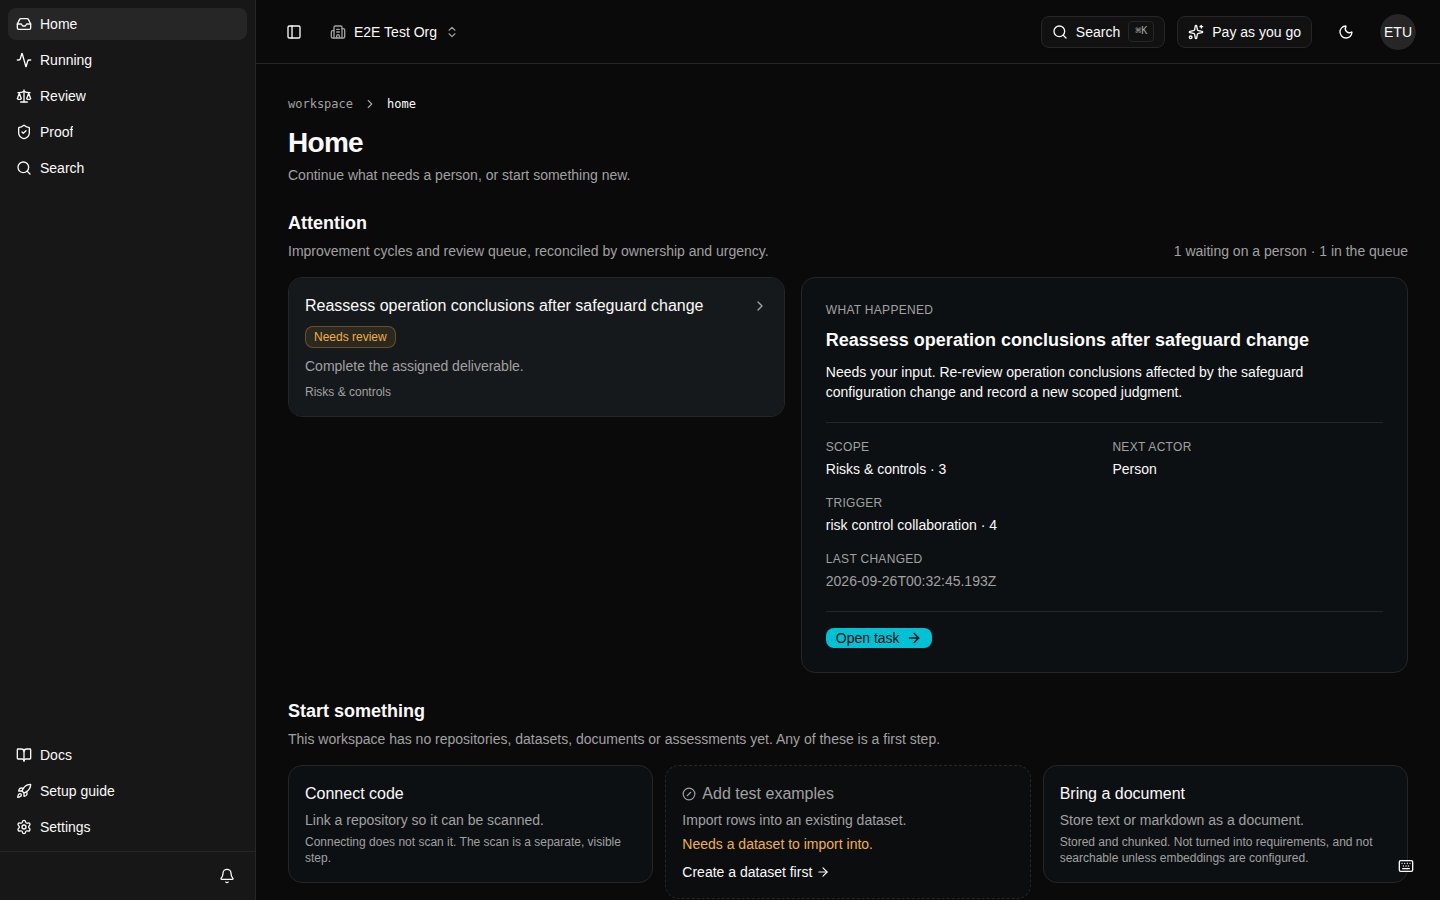
The sidebar
The sidebar is deliberately short. It carries only the places you return to most:- Home (
/dashboard) — work waiting on a person. - Running (
/running) — work in flight. - Review (
/review) — decisions that need a human reviewer. - Proof (
/proof) — what was measured, decided, and enforced. - Search — opens the search box (
⌘K/Ctrl+K) for everything else.
/repository-intelligence),
Verification (/eval-loop), Continuous evaluation, Developer, and more — opens
from Search in the sidebar or header. Older links such as /traces or
/scorers redirect to their new home.
Copilot lives on the dashboard and on Prompt, Dataset, and Scorer hubs, plus
/copilot for proposal history. The workspace switcher in the header changes
workspaces; your avatar menu opens settings and signs out. There is no mounted
command palette (Cmd+K) and no Records chrome section.
To hide the sidebar, click the toggle at the left of the header.